
Your Media Rep Says Your Customers Are Watching Their Station. But Are They?
You’ve sat through the pitch. The TV rep slides a glossy one-sheet across the table showing their station’s ratings for “Adults 25-54” or “Household Income $75K+.” They promise you’re buying the audience that matters. You nod, sign the contract, and hope it works.
Here’s the problem: that rep’s numbers don’t tell you where your customers actually are. They tell you where a broad demographic slice of your market spends time. And unless you’re selling to every adult in town, that’s not the same thing.
Why Most Contractors Buy Media Based on Whoever Sold Them Last
Most home services business owners make media decisions one of two ways. Either they stick with what worked five years ago because change feels risky, or they buy based on their own personal media habits (ie, “I watch X News and listen to Y radio station”).
The radio rep says their morning drive time dominates. The cable rep says streaming is overrated. The digital agency says TV is dead. Everyone has data that supports their own inventory. And you’re left trying to piece together the truth from a stack of conflicting sales presentations.
The real issue isn’t that any of these reps are lying just to sell you. It’s that they’re showing you data about everyone instead of data about the specific people who hire HVAC companies, roofers, or remodelers. And that distinction changes everything.
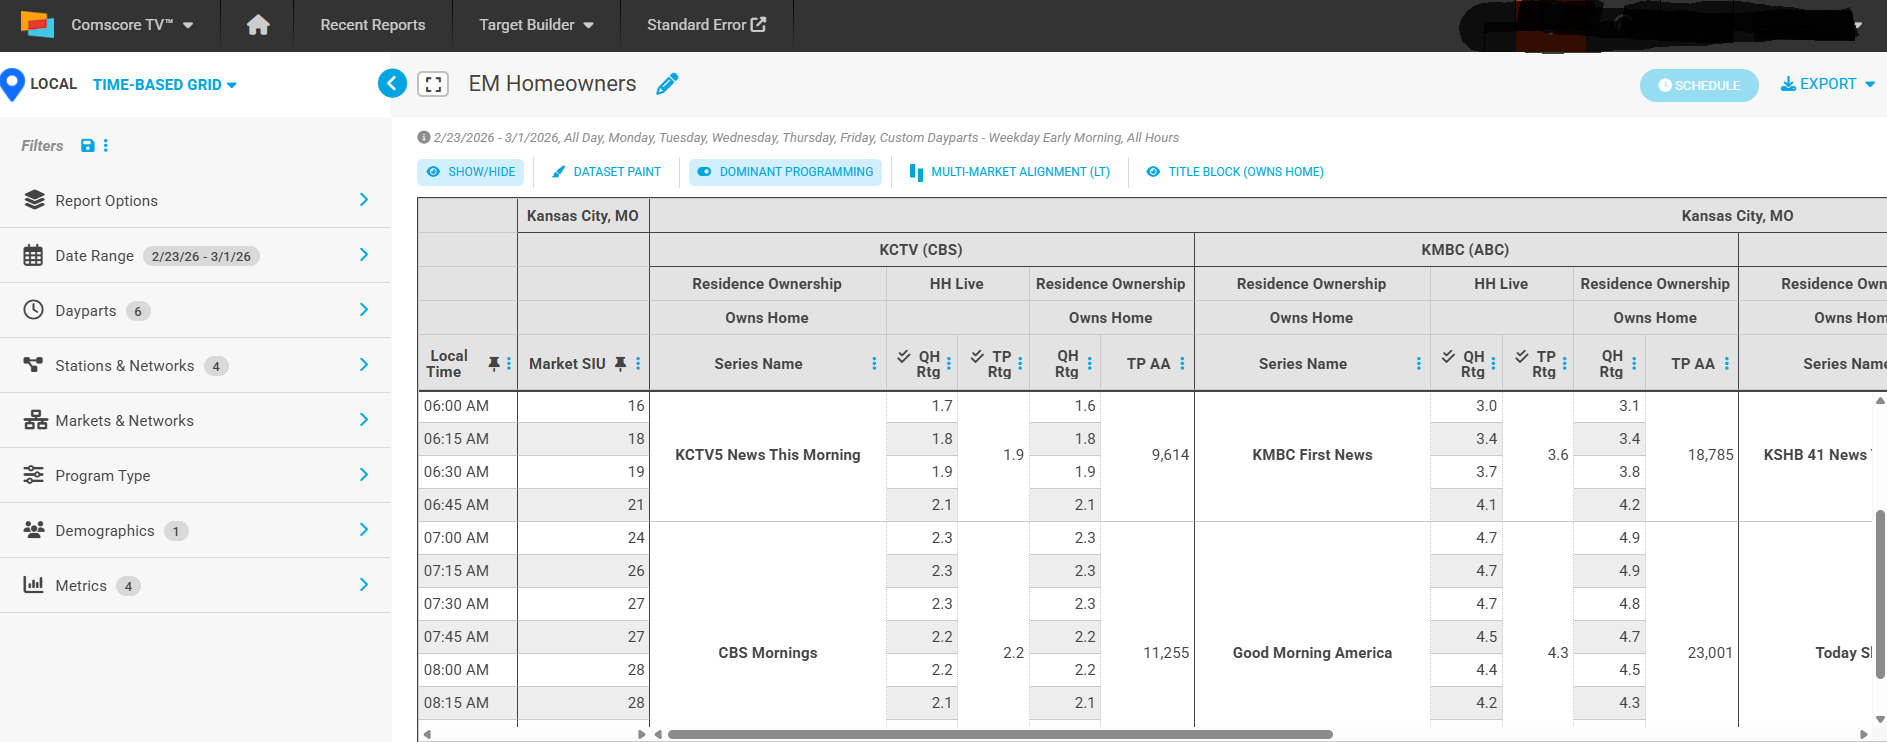
What comScore Actually Measures (And Why It Matters for Home Services)
comScore measures media consumption across 1-in-3 households in the United States. That’s not a survey. It’s not modeled data. It’s direct measurement of what people actually watch, listen to, and click on. comScore captures TV viewing through set-top boxes, streaming through partnerships with major platforms, and digital behavior through tagged browsers and apps.
For a contractor trying to figure out where to spend $50,000 on advertising, this matters because you can stop guessing and start looking at real patterns. When we run a comScore analysis for a roofing company in Columbus, Ohio, we’re not looking at “Adults 35-64” as a monolith. We’re looking at households that exhibit characteristics of roofing customers—higher home values, longer tenure in residence, specific geographic clusters.
The data reveals patterns that gut instinct misses. In one Midwest market we analyzed, roofing customers indexed 43% higher than the general population for local news consumption during weekday evenings. That’s not something you’d know from a standard media kit. It’s also not something that holds true in every market or for every trade.
This is where most media planning fails home services businesses. Your customers aren’t where the average person is. They’re in specific places at specific times, and those patterns vary by trade, by market, and by season.
How Daypart Behavior Changes by Trade
DW Creative’s American Homeowner Media Researchfound that 63% of homeowners stream content in the evening, compared to 41% watching cable TV and 37% watching local news. But here’s what the broad survey doesn’t tell you: which homeowners are doing what, and when they’re most receptive to your message.
When we layer comScore data with buying behavior, the picture sharpens. HVAC customers in emergency mode—people dealing with a broken furnace in January—show different media patterns than remodeling customers planning a kitchen renovation six months out. The emergency buyer is searching on mobile during business hours and checking Facebook between service calls. The planning buyer is streaming HGTV content at night and researching contractor reviews on weekends.
Gutter companies see different patterns entirely. Their customers skew older, own homes longer, and over-index for traditional media. In a recent analysis for a gutter client, we found their target audience watched 38% more local news than the market average and consumed significantly less streaming video than younger homeowner segments.
This isn’t about stereotypes. It’s about measured behavior. And it changes how you should allocate budget.
Using Audience Data to Challenge Your Vendor’s Proposal
The next time a media rep shows you a proposal, ask three questions that comScore data can answer:
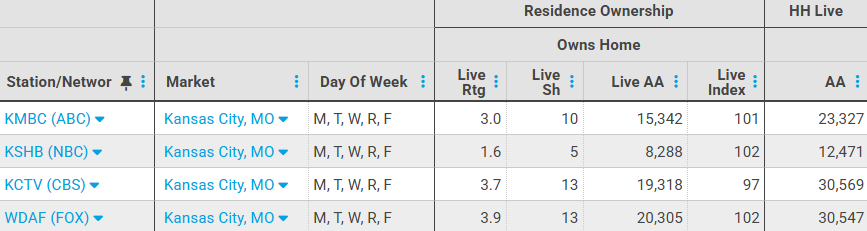
Question 1: What percentage of your audience actually owns homes? You’d be surprised how much advertising inventory gets sold to contractors based on reach numbers that include 40% renters. If you’re a roofing company, those impressions are worthless. comScore can break down homeownership rates by station, by daypart, by program.
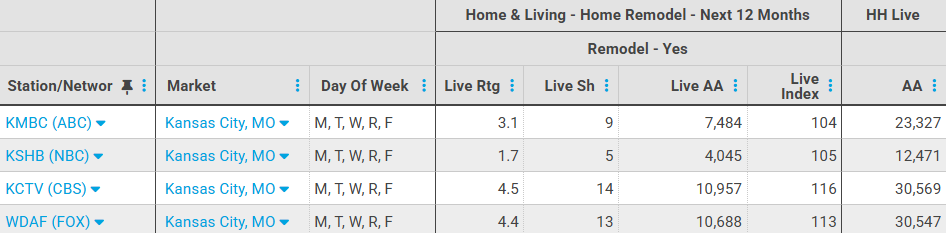
Question 2: How does your audience index for home improvement spending? Not every homeowner is your customer. The household that spent $30,000 on a kitchen remodel last year is more likely to hire you for the next project than the household that hasn’t picked up a paintbrush in a decade. comScore tracks behavioral signals that correlate with home improvement activity—everything from viewership of home improvement content to visitation of home services websites.
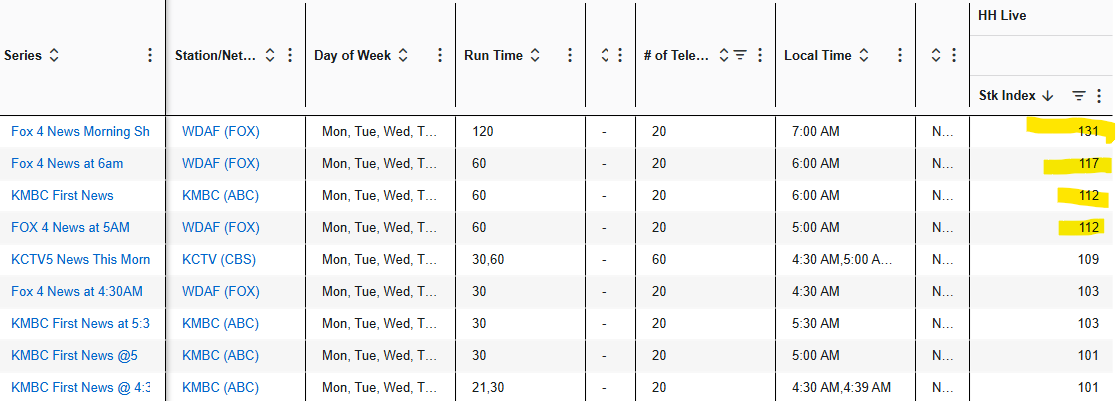
Question 3: When does your audience actually pay attention? A spot that airs at 2 p.m. on a Tuesday reaches a different audience than the same spot at 6 p.m. on a Sunday. comScore’s minute-by-minute measurement shows not just who’s watching, but when attention peaks. For home services, this matters more than most categories because your customer’s mental state when they see your ad determines whether they remember you when they need you.
Most media reps can’t answer these questions because their data doesn’t go that deep. They’re selling tonnage—total impressions, total reach. What you need is precision.
What This Looks Like in Practice
We worked with a remodeling company in a mid-sized Northeast market that had been splitting their budget evenly between between the NBC and ABC stations. When we ran comScore analysis on their target customer, we found something unexpected: their ideal clients over-indexed heavily for the CBS, a station they weren’t buying!
Bonus – the CBS was “cheaper” than the other stations because its relative reach to the overall market was smaller. However, the composition of audience that made up who was watching that CBS, was proportionally higher than the “more expensive” stations. We not only leveraged our spend but leads have increase by 20%.
This is what evidence-based media planning looks like. You stop buying what sounds right and start buying what the data proves.
Why Most Contractors Never See This Data
comScore isn’t cheap, and it requires expertise to analyze correctly. As of April 2025, comScore has received accreditation in all 210 media markets. They are becoming a serious player to the Nielsen ratings monopoly.
That’s the gap DW Creative fills. We subscribe to comScore, Nielsen, and other measurement platforms because it’s our responsibility to have a deep understanding of a client’s customer and their media habits.
Next Steps for Using Audience Data in Your Media Planning
- Stop accepting vendor data at face value. Ask for audience composition breakdowns, not just reach and frequency. If they can’t provide it, they’re guessing. Most station groups have comScore data for Nielsen comparison.
- Question any proposal that treats “homeowners” as a single audience. A 32-year-old first-time homeowner and a 58-year-old empty-nester consume media differently. Your message and placement should reflect that.
- Look for behavioral signals, not just demographics. Age and income matter, but intent to spend on home improvement does as well. Look at both for directional guidance.
- Test your assumptions with measurement. If you’ve been running the same media mix for three years, your audience has likely shifted. What worked in 2021 may be wasting money today.
- Work with someone who has access to third-party measurement tools. Relying only on data from the people selling you media is like asking the fox to audit the henhouse.
The DW Creative Perspective
DW Creative uses comScore data as a foundation for every media plan we build. Before we recommend a single station, platform, or daypart, we analyze where your specific customer segment actually spends time. We layer comScore insights with Nielsen Scarborough data for attitudinal patterns. This isn’t extra—it’s how media planning should work. If you’re tired of making channel decisions based on who sold you last or what worked a decade ago, schedule a fit call with our team.
Want to Keep Learning?
If you want to go deeper on this topic, we recommend the following articles about evidence-based media planning and audience targeting for home services companies.